Table of Contents
MaTYSSE outreach - main results
Here are a few images illustrating results obtained with MaTYSSE.
characterizing the hot Jupiter of V830 Tau
a hot Jupiter around V830 Tau?
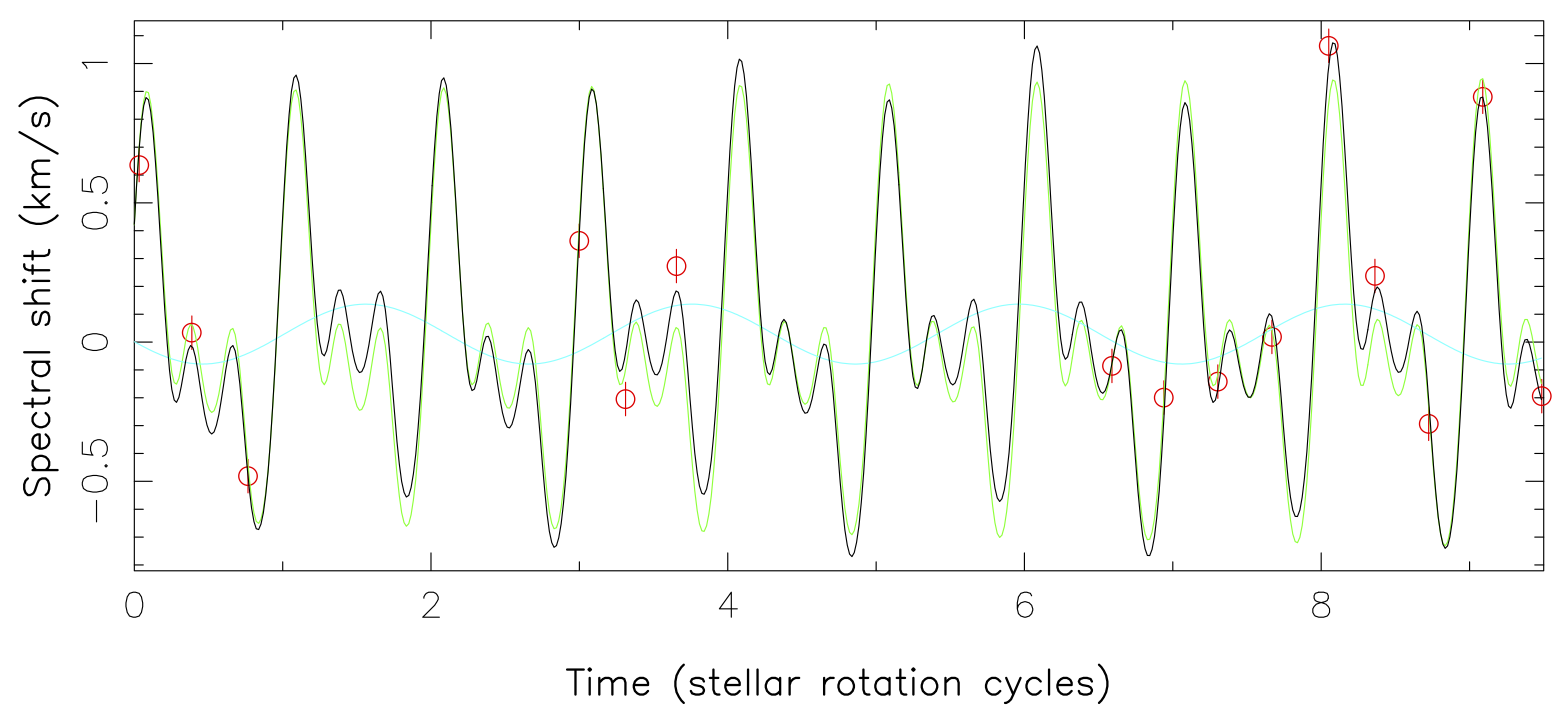
- 2015 Aug: MaTYSSE observations of V830 Tau, a baby star in the Taurus nursery. The measured shifts of the spectrum (red dots and error bars) vary with time as the star rotates, as a result of both surface spots and potential planets. Thanks to tomographic modeling, one can accurately predict the effect of surface spots on the spectra (green curve), which repeats almost identically from one rotation cycle to the next. This modeling gives access to the much smaller reflex motions induced by potential hot Jupiters as a separate time-dependent contribution varying with a different period. In the case of V830 Tau, the presence of a 1.4 Jupiter-mass planet orbiting at only 1/15th of the Sun-Earth distance (light blue curve, 7x times smaller in amplitude than the green curve) is required in order to fit the data within the error bars (black curve). More densely-sampled observations are necessary to validate this preliminary result.

3D magnetic topologies of wTTSs
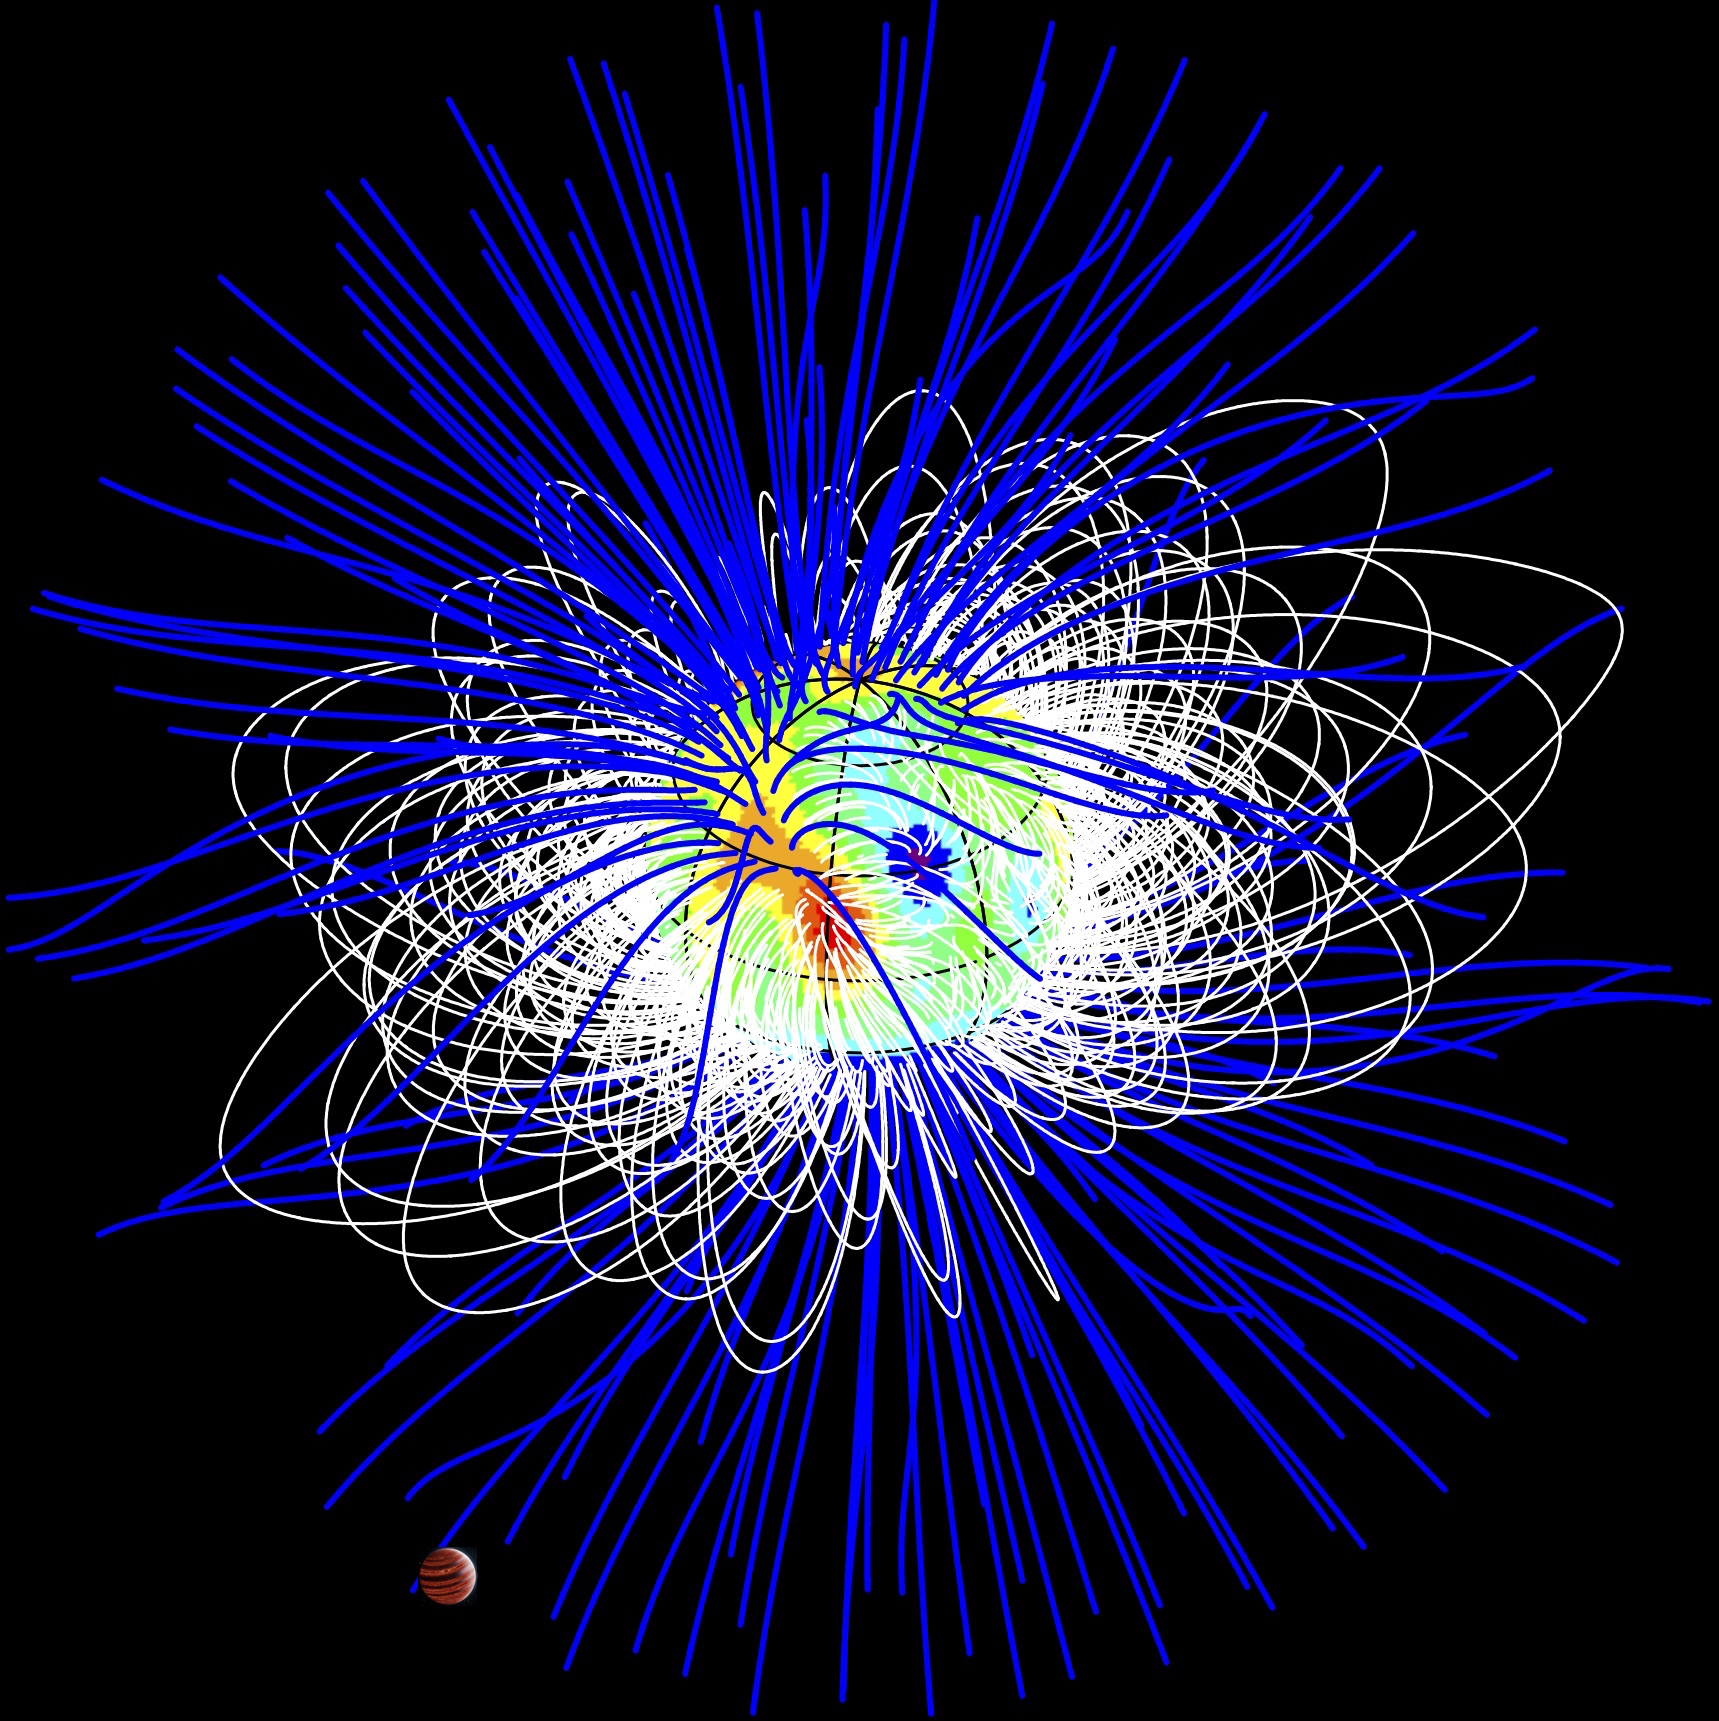
- 2015 May: giant magnetic loops at the surface of V830 Tau as reconstructed from MaTYSSE data collected at CFHT between mid 2014 December and mid 2015 January (open and closed field lines are shown in blue and white respectively, while colors at the stellar surface depict the radial field component from which the large-scale field was extrapolated)

